"Those algorithms of recommendation do a particular type of work [...]
They're all about past activities, and they stabilize around things that you have already done [...]
There are a number of consequences for that. If you live in a world that is driven by algorithms, it's always about what you have done and not what you might do. All of those things in the name of efficiency.
It's about, in some ways, flattening out the highs and low."
Genevieve Bell (2014)

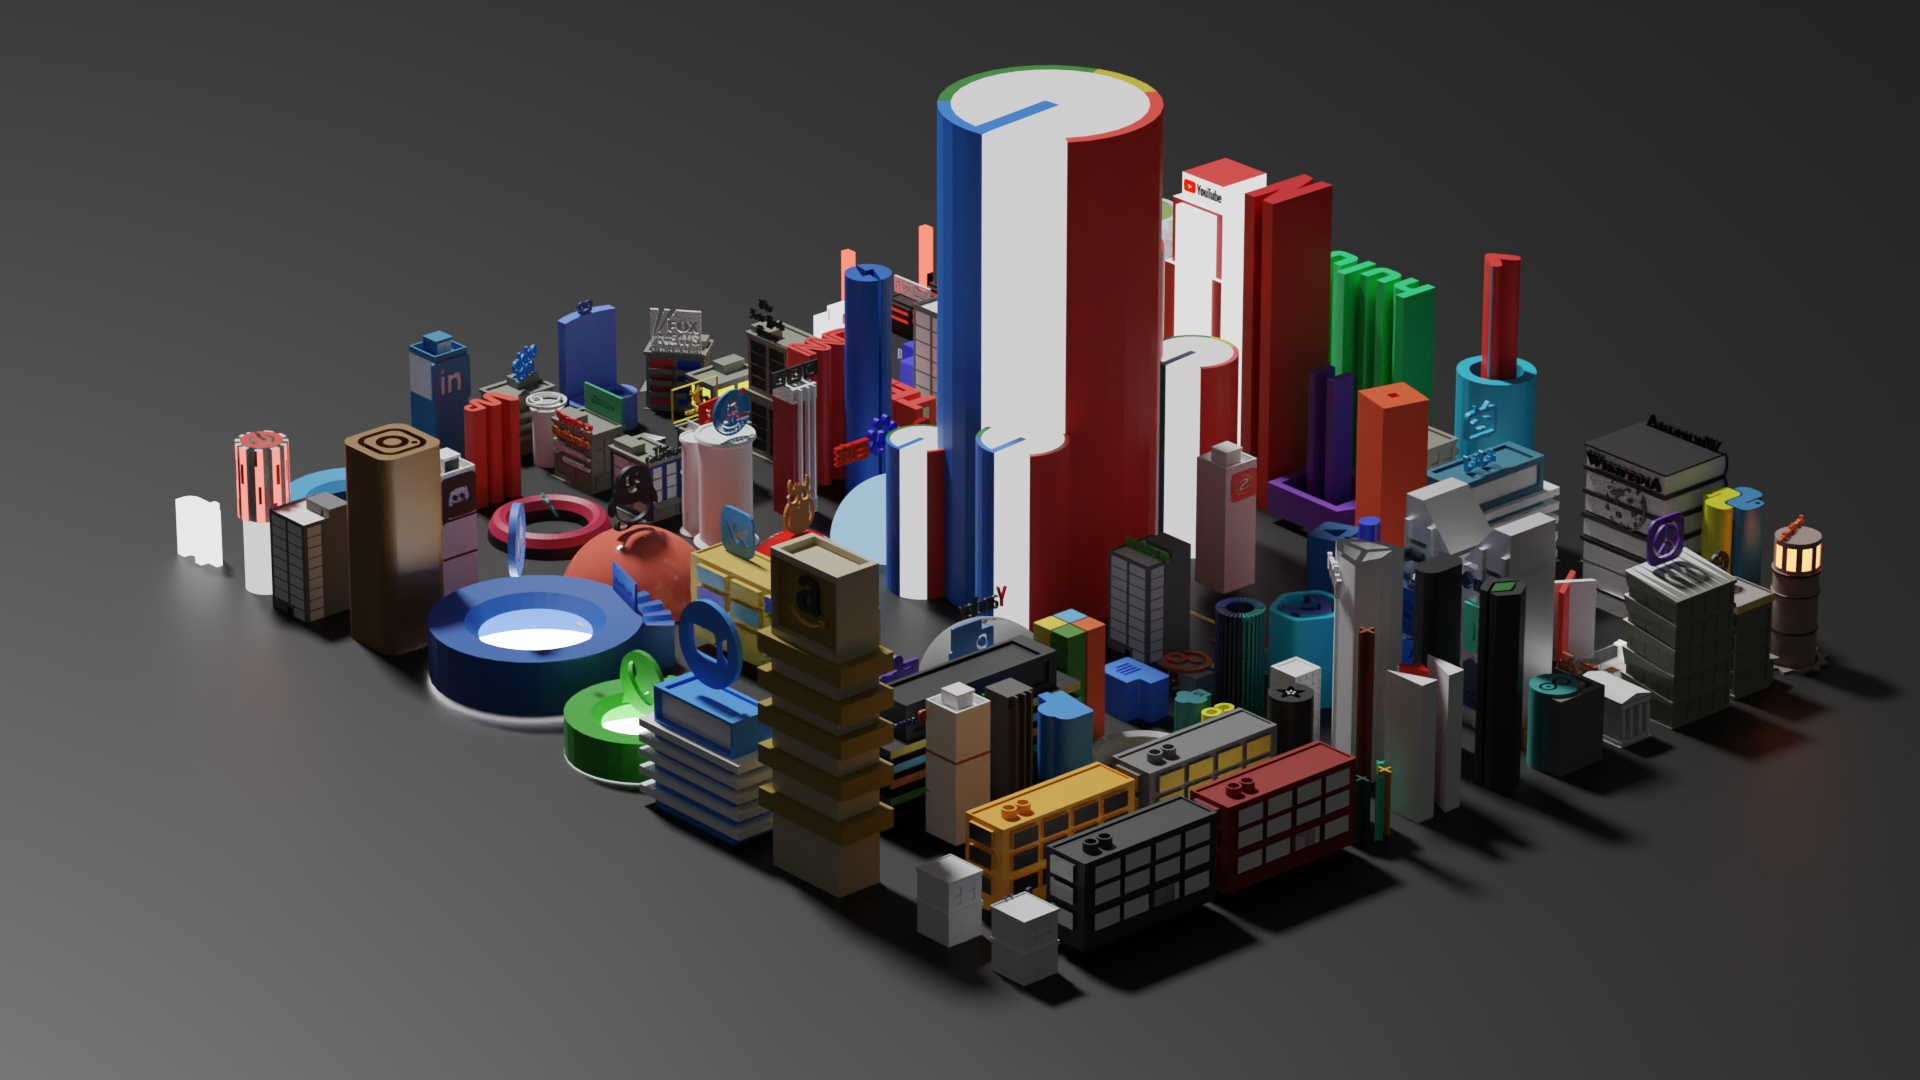
Browsing City (click to enlarge image)
Browsing City explores our relationship with information and recommendation algorithms as a way to reflect on our media diets, and the cultural equity of our digital spaces.
The project visualizes the movements that begin once our physical self becomes stationary, not to dismiss the usefulness of recommendation systems, but instead highlight our increasing dependency on them. If the internet was a city that we could touch and walk through:
- would we interact with each other differently?
- would we take the roads less traveled?
- would we build/organize it differently?

Extended Reality (XR)/Augmented Reality (AR)/Virtual Reality (VR) offer new dimensions for interactive experiences. By capturing the added value provided by VR, I attempt to recreate the internet browsing experience into a mechanism for reflection. To create this working prototype, I dive into my own browsing history, covering a period of four months. The idea is simple, I will build a virtual city that captures the websites that I visited the most, placing them inside a larger context of the web's most visited places. By superimposing my past self (ie- browsing history) through an avatar and by simultaneously navigating this virtual space using an Oculus Quest headset, I seek to raise questions around my own information consumption, the corners of the web I spend the most time in, and the ways in which recommendation systems dominate our online experiences.

What's out there?
Ironically, my research begins where it often does: a recommendation engine. Using Google, I begin to search for existing projects that aim to provide better data visualizations of browsing histories, or ways for internet users to look into their browsing history. Projects centered around the use of browsing histories are not new. Visual.ly, Iconic history, and similarly oriented research papers are some of the tools that allow the saavy internet user to understand their history through word clouds or favicon based visualizations.
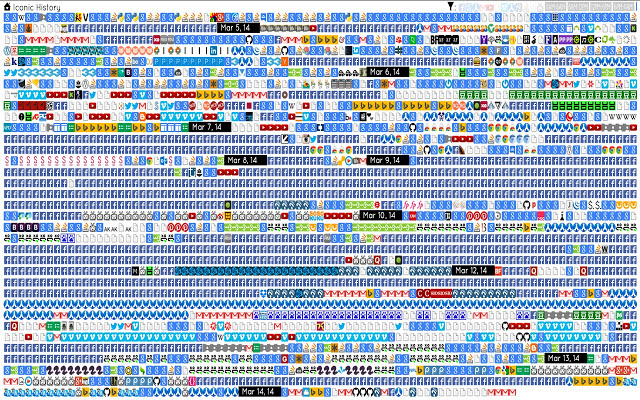
But while these tools present a good starting point, the added value of 2D icons and word bubbles seemed minimal in its impact. In brief, though these products provide a scalable use case through easy to use plugins, the insights they provide seem to be less transformative in outcome. This observation fueled my eagerness to pursue my idea.
Where to start
Because of the sensitivity related to sharing this private data, I quickly realize that I would have to use my own browsing history. The challenges of trying to capture such a large dataset present themselves almost immediately. Do I use both my laptop and my mobile phone as sources of data? If so, how will I merge the two datasets? How do I categorize the sites? What about the actual time spent on each site?
In the end, what followed was an exercise in assumptions, biases and brute force data sifting and wrangling. The first resolution was the exclusion of my mobile phone data- the experience would have to rely solely on the data coming from my laptop. Using my phone data would mean not just capturing browsing data but also in-app interactions, and these are extremely difficult to find unless one is actively capturing the hundreds (read thousands) of shared news and media on these platforms. While it would create a serious deficiency in what's actually visualized, attempting to integrate this data would muddy the larger dataset. Because I only use one browser (Firefox) on my laptop, and because the device itself was recently purchased - and thus the dataset would represent the entirety of my recent browsing history- I chose to instead work with it alone. Mobile browsing data would have to wait.
Sifting/wrangling data
Once I located the folder that held all of my laptop's (Firefox) browsing data on my local drive, I found the places.sqlite file (a database file format) that contained all the information I needed. Using DB Browser I was able to export/retrieve just over 10,000 links as a .csv file. As I began to categorize the links manually, I started to reflect on the amount of decisions that similar datasets undergo at the hands of individuals/groups. I was in full control of how the set would be analyzed, simplified and ultimately made usable. Lucky for me, this was my own data, and since the final outcome itself is geared towards my understanding of my own online information consumption, as long as I held true to my framework and constant decisions then I could build something reliable, for myself. How many of the datasets we come to interact, or even build upon have gone similar simplifications in the name of usability? The answer is one that is worth dwelling on.

My categorization process was fairly simple. For example, all Google searches would fall under a category called "Google", my visits to ANU's student oriented platforms "Wattle", "3AI", "ANU LIbrary" would be under "ANU" and so on. By the end of this, I was left with 40+ categories, and 2,000 uncategorized links which mostly included single visits, popups and so on. Though tedious, one of the virtues of such a hands-on categorization was my ability to make decisions that I could explain, at an almost individual level. For example, if you're wondering why the single visit sites were not included in the final 8,000+ links that made the cut, it was because I identified most of them as Google search result links that I immediately closed out of once I saw that the information wasn't relevant to my needs. Again, this seems like an arbitrary judgment, and a similar decision elsewhere might have damaging cascading effects, but in this instance I was the judge,jury and executioner...of my own case.
Small fish in a big pond
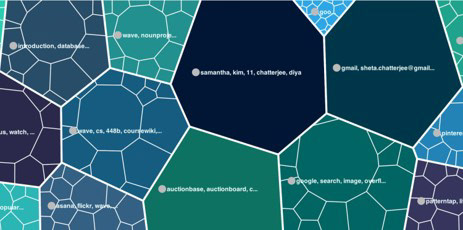
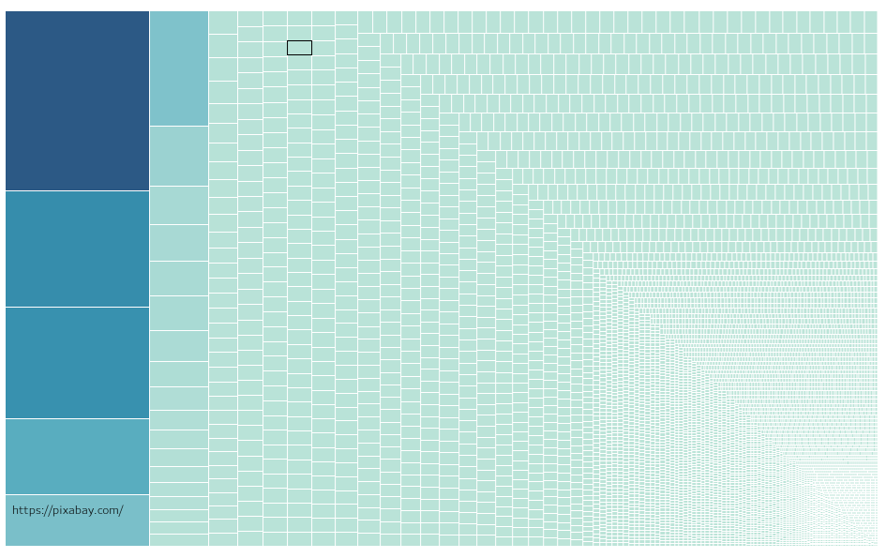
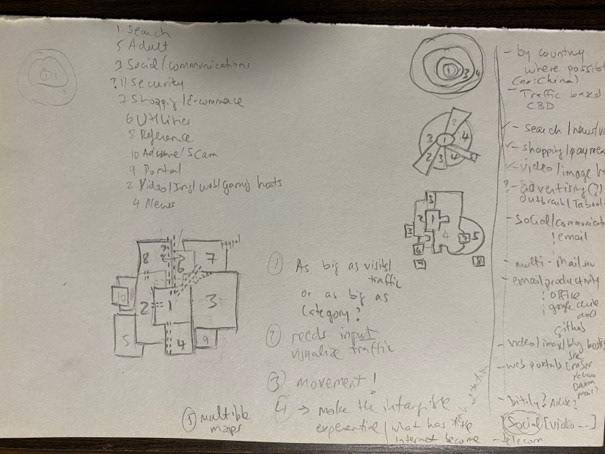
At this point I was beginning to consider how this would all transform itself into an internet town. My first instinct was to start looking at 2D charts as potential land plots or building heights that would visualize the frequency of my visits for each. For this I started with Tableau to progressively test out different forms. I eventually narrowed it down to stacked bars which would be useful to visualize building heights, and packed bubbles + treemaps which would help create the land plots of each website/building. As I was finalizing this process, I had an insight which forced me to expand my internet town into a city. What does this 3D representation mean without a larger context? Sure, I was going to capture my browsing history and at the very least it would help me understand which sites/resources I frequented the most, but is it a valid insight if it's not based inside the much much larger internet ecosystem? Or metaphorically speaking, I can see which school, office, bars, or libraries I was regularly visiting, but isn't it as important to see which ones I wasn't? My internet town would have to become an internet city.
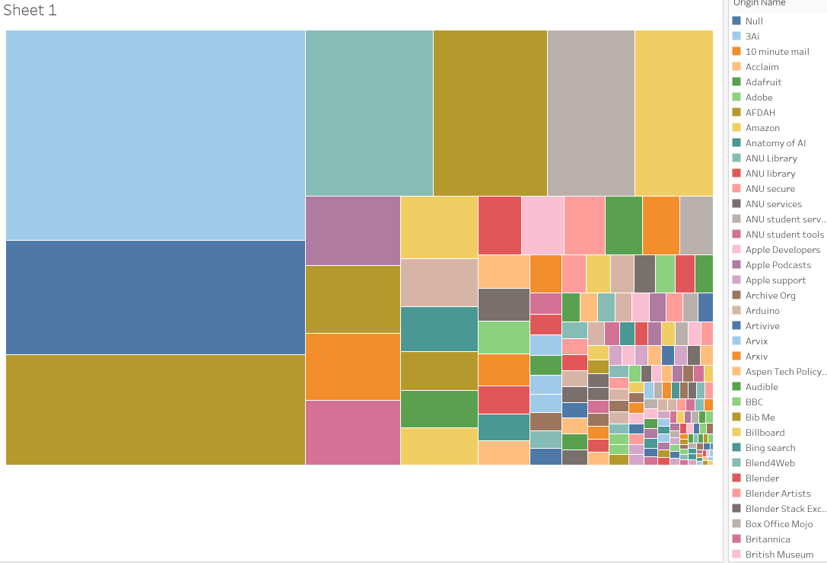

With an estimated 200 million active websites, attempting to capture all of these wasn't something I could even begin to consider. So I decided to include the sites that would be useful in bringing more opportunities for reflections and insights. Since the project is entirely based on my own data, I also wanted to use this pivot as a way to make the output more engaging to an outside audience. I concluded that using the top 100 most visited websites in the world (in reality approximately 120) would serve the above mentioned goals because it would represent, on average, websites visited by the outside audience (at least the ones that are connected), while (as I would confirm later) it would also demonstrate the dominant role of a few internet companies on our online experiences.
Using tools like Amazon's Alexa- Top Sites and Similarweb I was able to identify the top 100 most visited websites for the month of April 2020. Because of the COVID19 related recent increase in traffic experienced by a few websites that appeared on this list (ex: Zoom, Roblox, Instructure) I also decided to look at websites that made this list in August 2019. This added an additional 20 websites for a total of 120 websites. When merged with my most visited categories of websites, I was left with just about 140 websites to include in my internet city. Finally, I also realized at this point that I would have to discount the Tableau charts that were going to serve as blueprints for my city. Showing the frequency of my visits using the latter would be confusing, and maybe even useless when overlayed on top of the total traffic for these popular websites. The solution would be to visualize my movement inside of this internet city through an avatar of some sort. But first, I would have to start building the virtual city.

Urban planning
This project having now become an urban planning exercise, I started to research how cities are planned and built. Luckily for me, I wouldn't have to start from scratch because the goal was less about what the internet should look like, and more about what it had become. The internet's history and transformation is extensively documented. We won't dive deep into this, but Tim Berners-Lee's Information management proposal and Hossein Derakhshan's The Web We Have To Save are highly recommended readings to get some context about what this history looks like, especially with regards to information exchange.
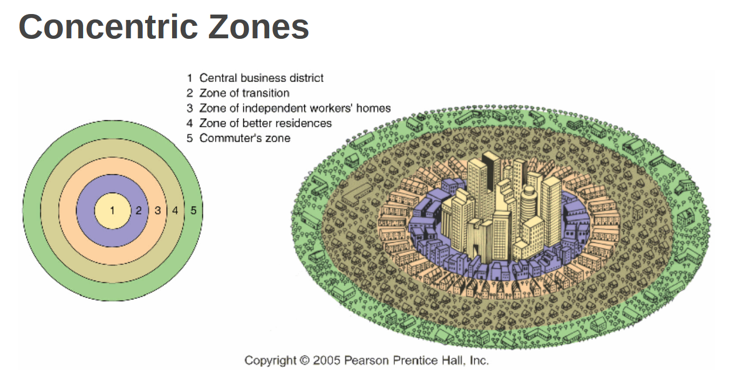
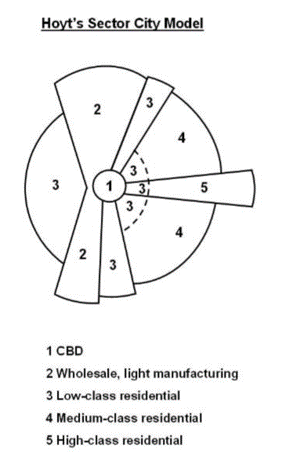
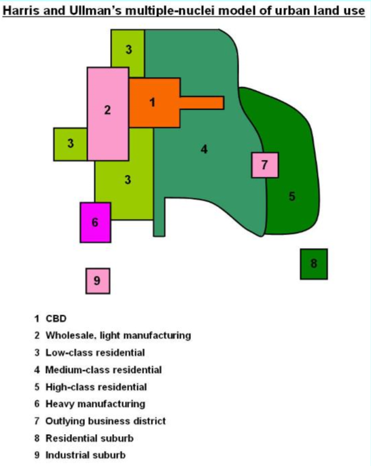
I found the template I was looking for when researching the history of urban planning. Using a case study by Matt Burdett I identified the multiple nuclei model as studied by Harris and Ulman in 1945 would be of great use in this project. Building on Hoyt's sector model (itself an improvement on Ernest Burgess's Concentric model which captured cities as circular rings with a central district at the center), Harris and Ulman understood cities to go beyond the sector model arguing that instead of sectors connected to a center, there are in fact many centers. I found this model appealing because the top 100 sites showed that many specialized categories (search, social/communications, utility, productivity etc.) could have their own leaders, with internauts circulating between these at one time or another.

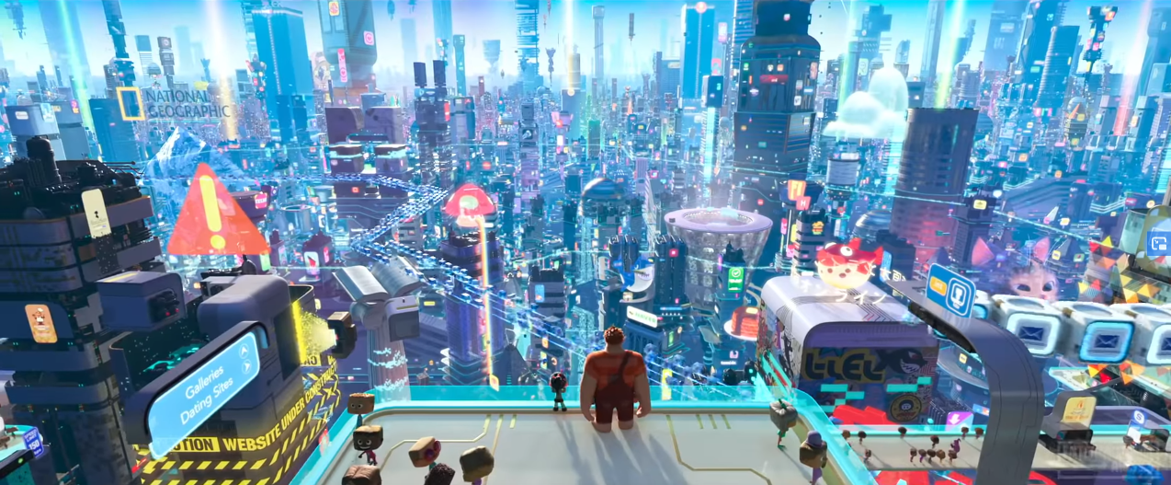
Another great piece of inspiration also came in the form of the animated movie Ralph Breaks the Internet, which captures the intricacies of the world wide web in a fantastic way. With a city plan ready, it was time to call in the builders.

Will it Blend?
Building the city inside of Blender (you can learn about how I learned this tool in this post) was fairly straightforward, give or take some metaphorical leeway I gave myself when modeling some of the buildings and sectors. Domed social networks to represent the Great Firewall of China, 3AI's actual studio to capture ANU related websites, a stack of books for Wikipedia/Google Scholar and Quora, stadiums for Facebook, Whatsapp and Tik-Tok etc, and of course a Red Light District for you know what. I opted to use building heights to translate traffic levels, with the understanding that fluctuations are likely to happen on a regular basis and as such how tall a building is is only representative of the current relative importance in the ecosystem.
Once the city was ready in Blender, I exported it to the game engine Unity in order to integrate it with the Oculus Quest headset, and add the avatar (simple cube for now) that would visualize my browsing history by navigating the virtual space using way points. The Oculus Quest integration was made easier by the fact that Oculus has a Unity compatible asset that can be imported into the project and can provide the necessary camera and movement for VR based scenes. Most of my headache in this regards came from a software update that has now retired this integration. Reinstalling and rebuilding the project in an older version of the software resolved this issue. With my basic programming knowledge of Python, I was also able to find a C# script (Unity supported) and adapt it to fit my needs in how the object/avatar that I had created inside of the scene would navigate between the buildings.
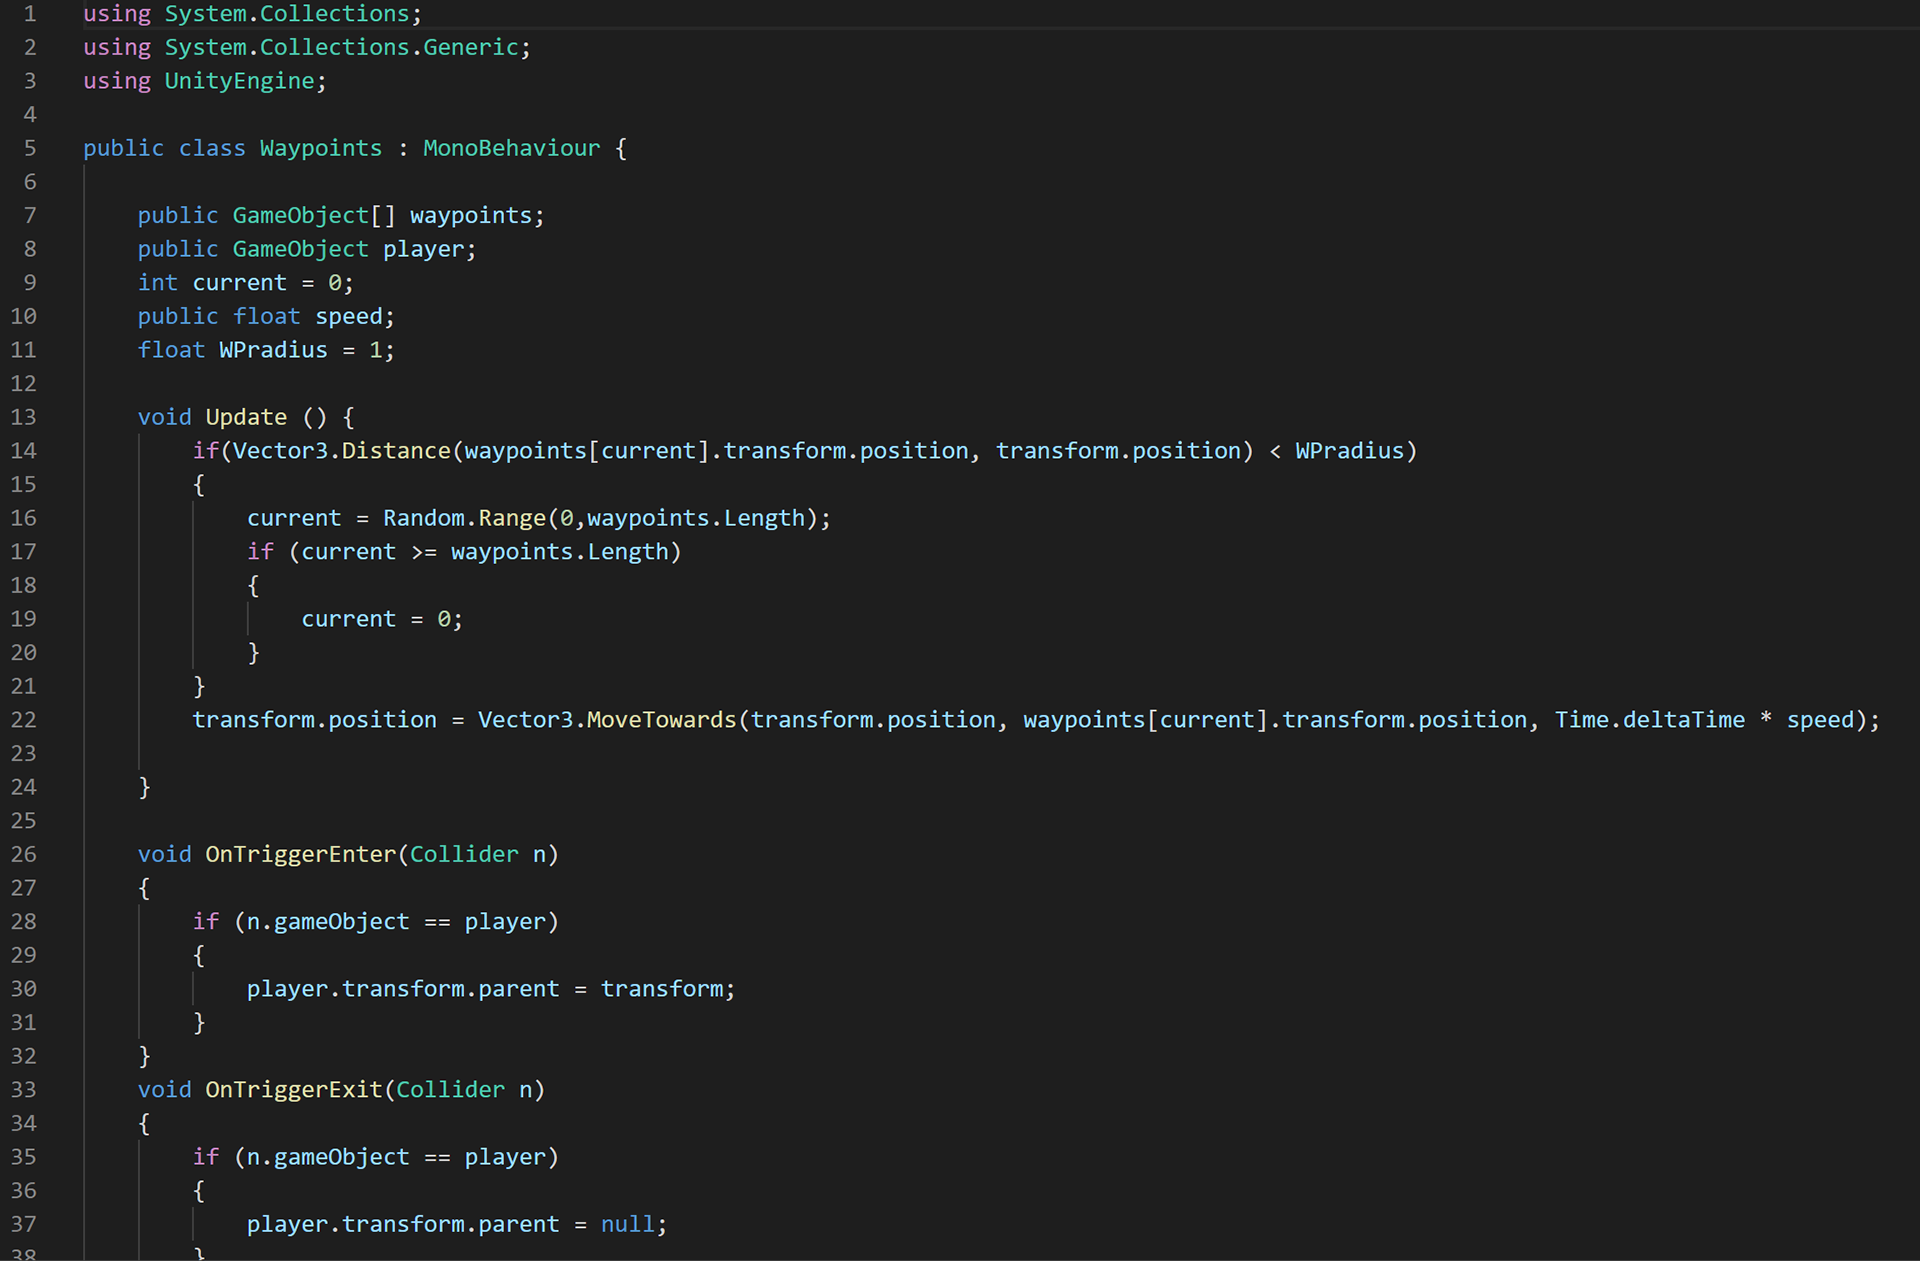
Unity script for object based waypoints movement
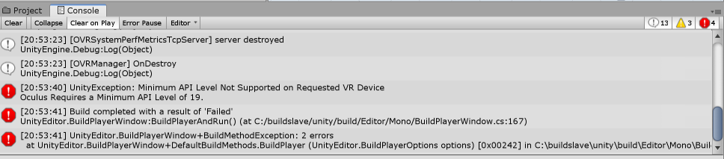
Some of the errors cause by Unity's new updates
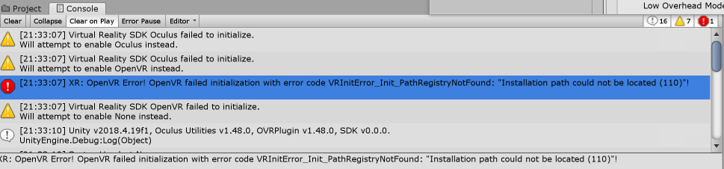
Fixing API connection issue for Oculus Quest, and creating more problems
With my scene, character movement and avatar now ready, I was ready to test.

Enter the Ethersphere

So What?
My first thoughts are about the improvements that this experience could benefit from. The 3D model built in Blender doesn't translate as well aesthetically (colors and size) inside of Unity, this is something that I will continue to polish. As for the city itself, it is an open ended project, so my hope is to crowdsource website recommendations by friends/family/colleagues and to include them in the cityscape. In the meantime, I could also look to add the equivalent of the "bottom 100" websites, or rather the meaningful and useful online spaces that have been swallowed by the growth of the dominant platforms. I also hope to show that web users can benefit from different recommendation systems, with some control ceded to them to instantiate browsing experiences that aren't always focused on optimization.
My first thoughts are about the improvements that this experience could benefit from. The 3D model built in Blender doesn't translate as well aesthetically (colors and size) inside of Unity, this is something that I will continue to polish. As for the city itself, it is an open ended project, so my hope is to crowdsource website recommendations by friends/family/colleagues and to include them in the cityscape. In the meantime, I could also look to add the equivalent of the "bottom 100" websites, or rather the meaningful and useful online spaces that have been swallowed by the growth of the dominant platforms. I also hope to show that web users can benefit from different recommendation systems, with some control ceded to them to instantiate browsing experiences that aren't always focused on optimization.
The need to democratize our digital spaces is important, and though social media networks claim to democratize this space, the voices and information sources that are amplified beg for more diversity and inclusivity. This is even more apparent when we begin to look at the global landscape. The founders and owners of these platforms come from a list of countries that is single digits long. The promise of the world wide web has been cannibalized by a very few players that direct how we find information and interact with it. Secondly, I hope this project also points a finger at myself/the user. Perhaps we can only yearn for the return of tools like StumbleUpon that encourage surprise and show us things that we never thought we'd be interested in, but giving up our agency so easily should make us question our complicity in the internet we now have. This is only the start of this project, and I invite you to share with me some of your favorite online spaces through the contact form. How are we to find our next favorite corner if we don't take pleasure in the discomfort of being lost?
BONUS: Project timeline video
A step-by-step visual recap of the process to create a browsing city.